Conversion Report
Attribution Conversion Report
The Attribution Conversion Report section enables users to track and analyze revenue generated and the total percentage of sales based on various metrics such as contacts in the customer relationship management (CRM) system, opportunities, and sessions.
This section is ideal for keeping track of the success of moving leads through sales processes and the amount of revenue generated for the business.
NOTE: Depending on your user permissions, you may not have access to all of the components.
Choose Source Type
Select the type of data you'd like to include in your attribution reports to gain valuable insights tailored to your specific needs. You have the option to choose from Forms, Surveys, or Calendars.
By selecting Forms or Surveys, you can analyze the performance of various lead generation forms on your website, as well as evaluate the effectiveness of customer feedback initiatives.
If you opt for Calendars, you can assess the impact of scheduled events and appointments on customer engagement and conversions.

Select Date Range
In order to accurately analyze attribution data, users must filter and set specific date ranges, which can be done with the Select Date Range button.
Simply click on the calendar button to select the date range you would like to view, then click the green check mark button to save your selection and view your new data.

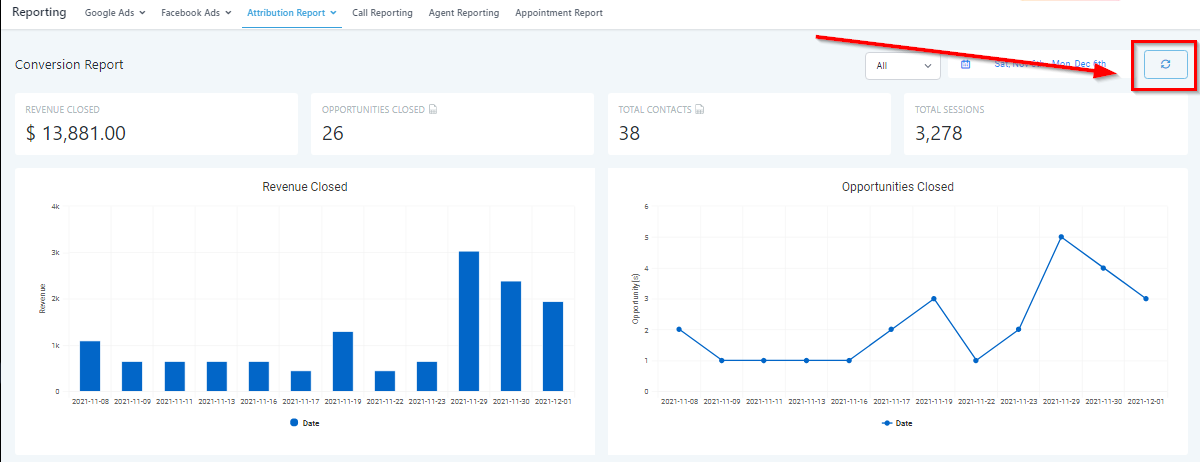
Refresh Data
By clicking on the refresh button, you can quickly update all the data displayed below without the need to refresh your entire browser tab or window.
This convenient feature ensures that you have access to the most current and accurate reporting information at all times, enabling you to make well-informed decisions based on real-time data without disrupting your workflow or user experience.
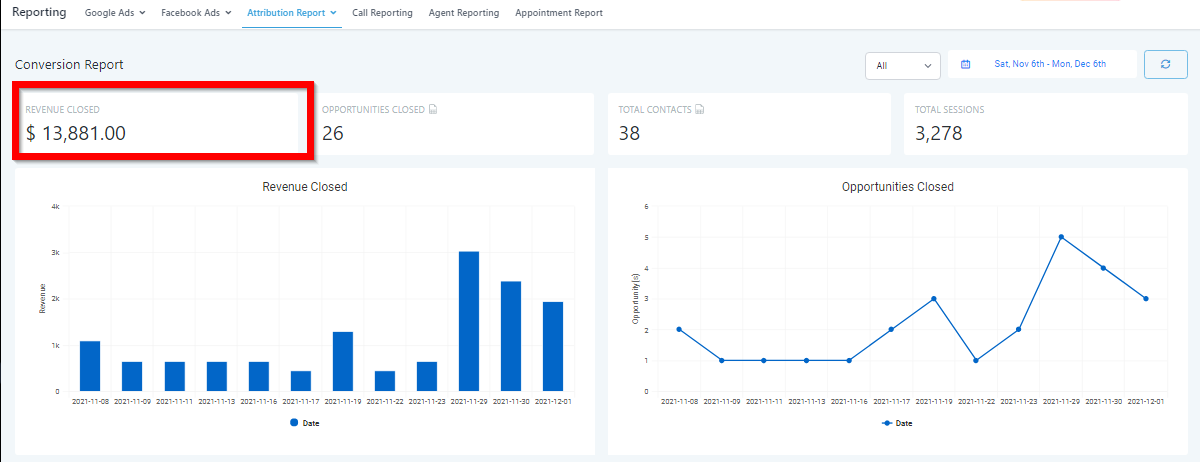
Revenue Closed
Monitor the revenue your business has generated during a specific time frame to gain valuable insights into your financial performance.
Opportunities Closed
Keep track of the number of opportunities you've successfully closed during a specific time frame to evaluate your sales performance and conversion rates.

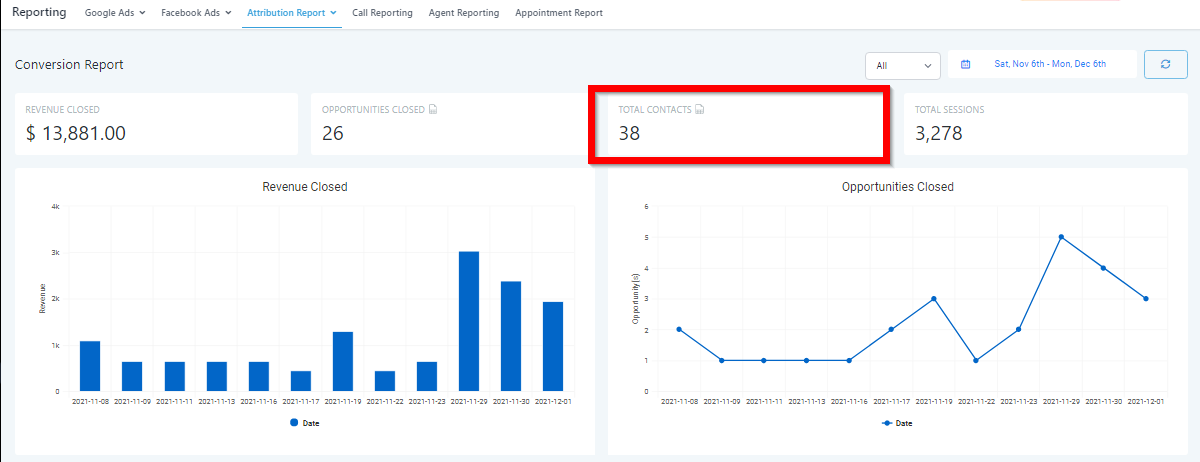
Total Contacts
Monitor the number of contacts you've gathered during a specific time frame to assess the effectiveness of your lead generation and marketing efforts.
Total Sessions
The Total Sessions metric allows users to monitor the number of sessions created during the selected period, which includes website traffic, forms, surveys, and calendar visits.

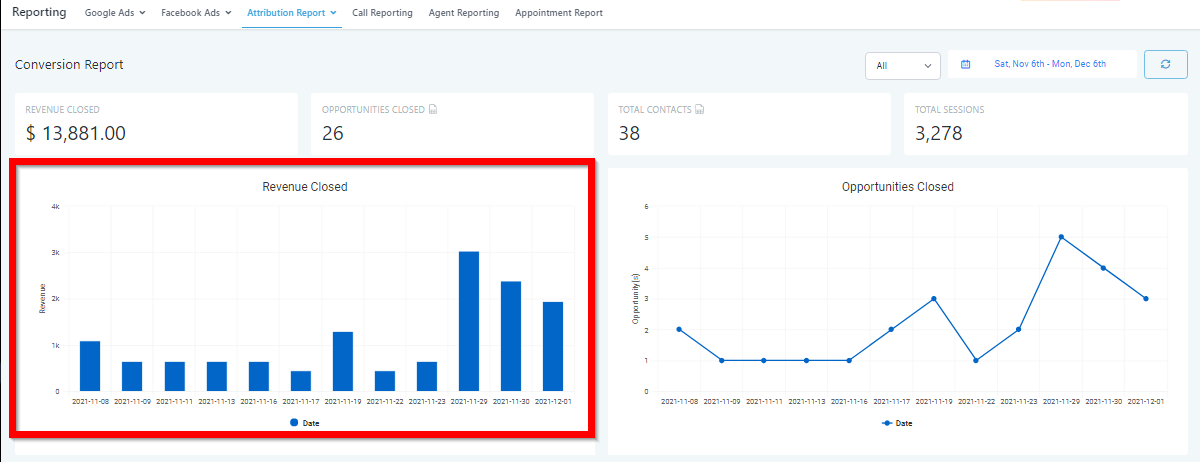
Revenue Closed - Timeline
In the Revenue Closed - Timeline section, users can view a timeline of the revenue generated during a specific period, which changes as they alter the date range in the top right corner of the screen.
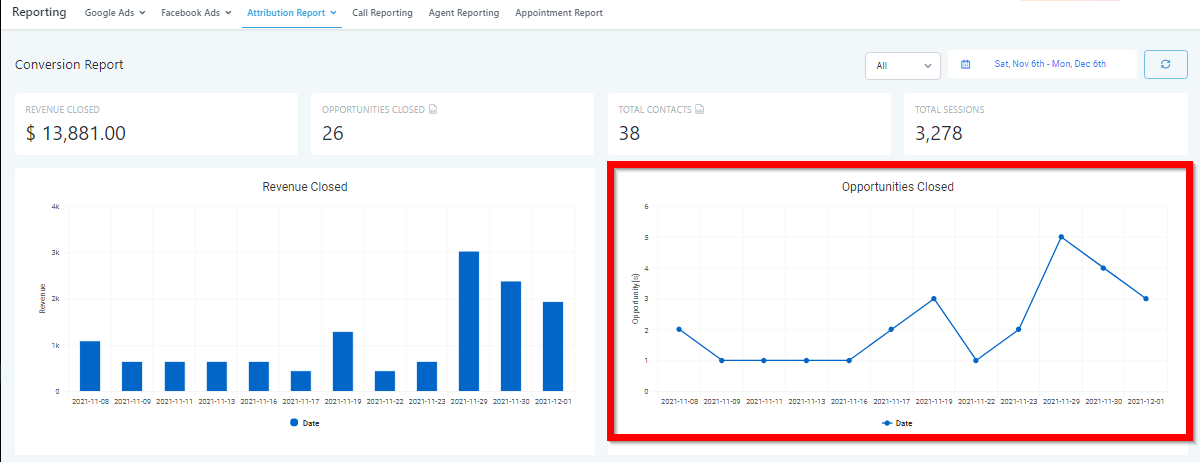
Opportunities Closed - Timeline
The Opportunities Closed - Timeline section displays a timeline of closed opportunities during the selected period, with the timeline changing as users adjust the date range.
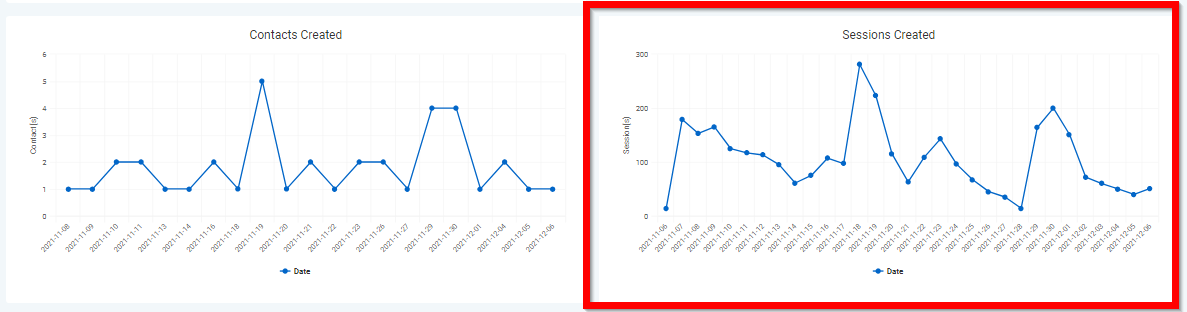
Contacts Created - Timeline
The Contacts Created - Timeline section displays a timeline of contacts created during a specified period, which updates as users adjust the date range in the top right corner of the screen.

Sessions Created - Timeline
The Sessions Created - Timeline section presents a timeline of sessions created over the selected period, including website traffic, forms, surveys, and calendar visits.
Opportunities Closed - Traffic
The Opportunities Closed chart shows you the timeline of opportunities that you've closed and where they came from.
You can easily track the traffic sources that led to these closures, such as Organic Search from search engines like Google and Yahoo, Social Media platforms like Facebook and Twitter, and Direct Traffic.
The source of traffic will be displayed on a timeline, and you can adjust the date range in the top right corner of the screen to change the information displayed.

Contacts Created - Traffic
The Contacts Created chart displays the timeline of contacts you've created and the traffic source they originated from.
The sources of traffic include Organic Search from search engines like Google and Yahoo, Social Media platforms like Facebook and Twitter, and Direct Traffic.
You can view the traffic sources on a timeline, which changes as you adjust the date range in the top right corner of the screen.
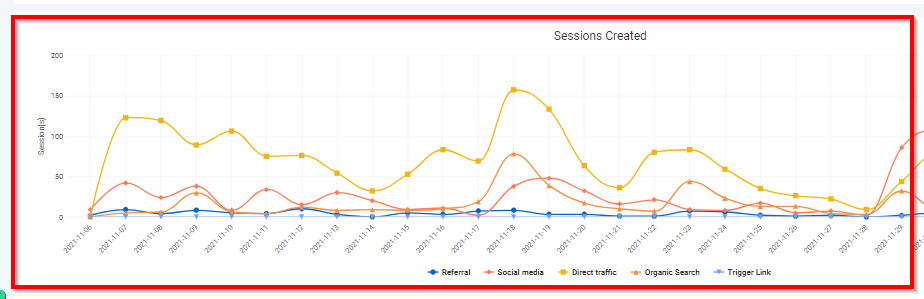
Sessions Created - Traffic Source
The Sessions Created chart displays a timeline of sessions you've created and the traffic source that generated them.
The sources of traffic include Organic Search from search engines like Google and Yahoo, Social Media platforms like Facebook and Twitter, and Direct Traffic.
As you adjust the date range in the top right corner of the screen, the timeline will also update to reflect changes in the traffic source.
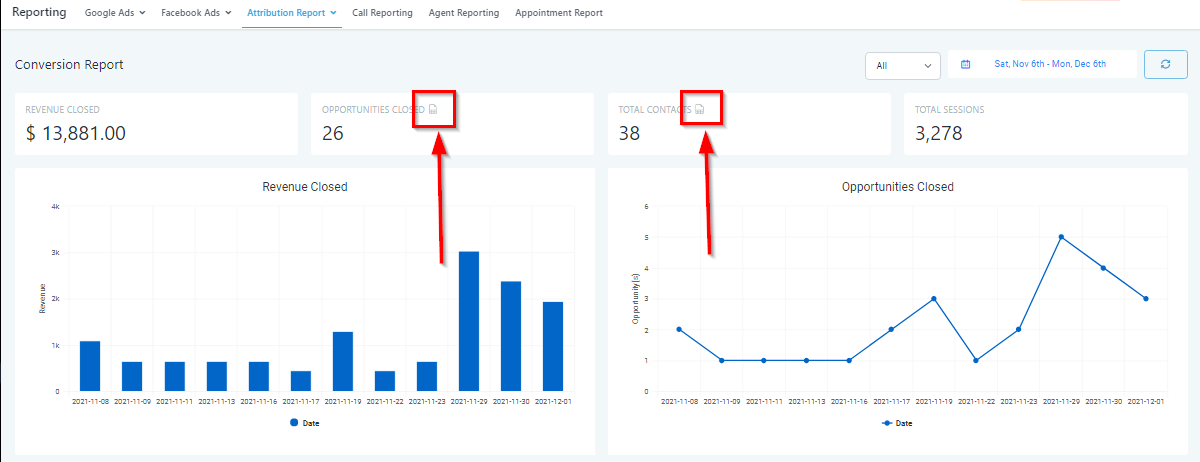
Show/Export Data
By clicking on the Show/Export Data icon, you can view a list of contacts that were created within a specific time frame and export this data to an excel sheet.
The same feature is available for tracking opportunities closed, allowing you to see which opportunities were closed during a particular period and export this information to an excel sheet as well.